
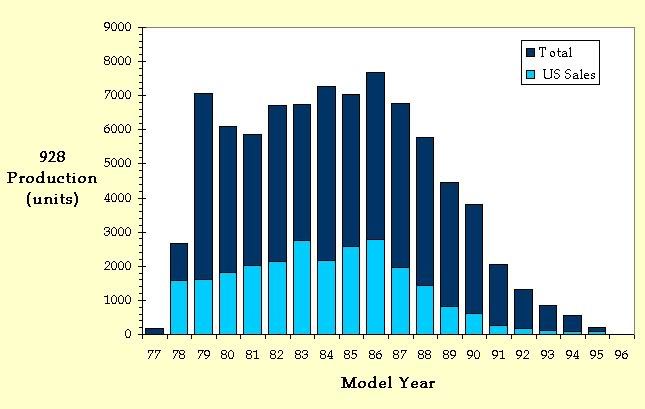
928 production graph 1977 to 1995
 05-23-2014, 11:16 AM
#1
Instructor
Thread Starter
Join Date: Aug 2005
Posts: 128
Likes: 0
Received 0 Likes
on
0 Posts
I am absolutely sure this info already exists here on the forum in some form, and I may have actually posted it years ago under a slightly different login name.
I always enjoy looking at this chart, helps keep things in perspective about just how rare these things really are. This is especially true when you know FoMoCo
sold about a half million Mustangs in 1965
...................................................................... ...........................................................
928 production during the last five years (actually import numbers to the US) is almost non-existent.
Based on my own experience here in the mid-south, seeing fewer and fewer of these cars each year on the road, and now having seen none in over
a year, the rare factor starts to sink in a bit more.
Regards,
P
I always enjoy looking at this chart, helps keep things in perspective about just how rare these things really are. This is especially true when you know FoMoCo
sold about a half million Mustangs in 1965
......................................................................
...........................................................928 production during the last five years (actually import numbers to the US) is almost non-existent.
Based on my own experience here in the mid-south, seeing fewer and fewer of these cars each year on the road, and now having seen none in over
a year, the rare factor starts to sink in a bit more.
Regards,
P
 05-23-2014, 11:27 AM
#2

I am absolutely sure this info already exists here on the forum in some form, and I may have actually posted it years ago under a slightly different login name.
I always enjoy looking at this chart, helps keep things in perspective about just how rare these things really are. This is especially true when you know FoMoCo
sold about a half million Mustangs in 1965
928 production during the last five years (actually import numbers to the US) is almost non-existent.
Based on my own experience here in the mid-south, seeing fewer and fewer of these cars each year on the road, and now having seen none in over
a year, the rare factor starts to sink in a bit more.
Regards,
P
I always enjoy looking at this chart, helps keep things in perspective about just how rare these things really are. This is especially true when you know FoMoCo
sold about a half million Mustangs in 1965
928 production during the last five years (actually import numbers to the US) is almost non-existent.
Based on my own experience here in the mid-south, seeing fewer and fewer of these cars each year on the road, and now having seen none in over
a year, the rare factor starts to sink in a bit more.
Regards,
P
 05-23-2014, 12:44 PM
#5
Instructor
Thread Starter
Join Date: Aug 2005
Posts: 128
Likes: 0
Received 0 Likes
on
0 Posts
Sean, that's the problem, I can't remember. I used to frequent numerous other forums, notably the 928S4VR site, no longer active, where I met Wally, Nicole, and see some other familiar names here. Like many people my interest in cars will come and go as my intererest in other things will either pull from it or allow more time.
Don't know what happened with the login here, had it for awhile, posted a bit here, probably went off on a several year hiatus, then had to go through and resurrect the login, whatever. I'll hunt around in some of the older postings and if I can find anything I'll send you a note, but it doesn't matter to me really.
Regards,
P
05-23-2014, 12:48 PM
#6
Naa, don't waste your time looking for it, it's not important. I just thought that your posting style was familiar and thought you'd been here before but didn't recognize the user name ...p. It's no big deal, was just curious.
Trending Topics
05-23-2014, 02:04 PM
#8
Archive Gatekeeper
Rennlist Member
Rennlist Member
Actually there are a lot more ROW GTSs than U.S/Canada .
US:
1993: 209
1994: 120
1995: 77
ROW:
1992: 955
1993: 621
1994: 523
1995: 399
US:
1993: 209
1994: 120
1995: 77
ROW:
1992: 955
1993: 621
1994: 523
1995: 399
The following users liked this post:
bayne (01-11-2024)
05-23-2014, 02:51 PM
#10
Rennlist Member
I don't know the source of the graph but it does not jive with what Rob posted. In 95 according to graph total GTS production was far below the 476 cars.
05-23-2014, 02:52 PM
#11
Rennlist Member
Well, dummy (me) that's what Rob said if I bothered to read it. Anyways, where did the graph come from?
05-23-2014, 03:00 PM
#12
Addict
Lifetime Rennlist
Member
Lifetime Rennlist
Member
I agree the graph does not accurately represent actual numbers. That '95 bar should be quite a bit taller to reach near the 500 mark.
05-23-2014, 05:11 PM
#13
Archive Gatekeeper
Rennlist Member
Rennlist Member
Pretty sure the chart in Post 1 is mislabelled on the y-axis, those are not production numbers, they're sales numbers.
The Sales numbers chart is listed on DR's site:
The Sales numbers chart is listed on DR's site:
Code:
Year	ROW Sales	US Sales	VIN# Series (US)
77	175	13	928 820 xxxx
78	1070	1584	928 820 xxxx
79	5438	1626	928 920 xxxx
80	4278	1824	92 A0 81 xxxx
81	3821	2036	WP0 JA0 92xBS 82xxxx
82	4570	2140	WP0 JA0 92xCS 82xxxx
83	3999	2746	WP0 JB0 92xDS 86xxxx
84	5095	2175	WP0 JB0 92xES 86xxxx
85	4460	2582	WP0 JB0 92xFS 86xxxx
86	4892	2780	WP0 JB0 92xGS 86xxxx
87	4791	1967	WP0 JB0 92xHS 86xxxx
88	4358	1427	WP0 JB0 92xJS 86xxxx
89	3627	835	WP0 JB0 92xKS 86xxxx
90	3196	620	WP0 JB0 92xLS 86xxxx
91	1792	263	WP0 AA2 92xMS 81xxxx
92	1132	183	No US Production
93	730	120	WP0 AA2 92xPS 82xxxx
94	470	84	WP0 AA2 92xRS 82xxxx
95	104	95	WP0 AA2 92xSS 82xxxx
96	 	5
Totals	57,998	25,105	Note "x" is generic and varies
05-23-2014, 05:54 PM
#14
Archive Gatekeeper
Rennlist Member
Rennlist Member
Here's a production number chart, not separating out early S vs. non-S, early v late '93, the CSs, S4 vs. GT, etc. Just ROW vs. US/Canada. Plus the 2010 U.S. 86.5's...

05-23-2014, 06:07 PM
#15
Rennlist Member
Thanks. What is that extra red line on the x between 86 and 87?